Blog
Deploying a Raspberry Pi–Based Environmental Monitoring System


This project began with a practical operational issue, rather than a research or learning exercise. A small equipment room experienced unexplained system shutdowns during warmer months, yet no consistent fault could be identified using standard monitoring tools. Temperature checks were performed occasionally, but these spot measurements failed to capture the conditions leading up to the failures.
It was suspected that temperature or humidity fluctuations might be contributing to the problem. However, without continuous data, there was no reliable way to confirm or dismiss this theory. What was needed was a simple system capable of recording environmental conditions over extended periods, enabling patterns and trends to be analyzed retrospectively rather than relying solely on real-time observation.
A Raspberry Pi–based solution was selected instead of a microcontroller for several practical reasons:
- Local Data Storage: Measurements needed to be logged reliably even when no network connection was available.
- Direct Terminal Access: During early testing, it was helpful to view sensor readings directly on the device through a terminal interface, without setting up additional visualization tools.
- On-Device Processing: The ability to perform basic data processing and file management locally simplified post-analysis once sufficient data had been collected.
Because the system was intended for long-term deployment inside an equipment room, reliability and stability were prioritized over experimentation or minimal component cost. The goal was not to build a feature-rich monitoring platform, but rather a dependable logging system that could operate unattended and provide meaningful data to support troubleshooting and informed decision-making.
System Overview & Design Thinking
The overall system was designed with a focus on reliability, simplicity, and long-term operability rather than maximum feature density. The core objective was to collect consistent environmental data over time with minimal intervention once deployed. As a result, both the hardware and software architecture were intentionally kept straightforward.
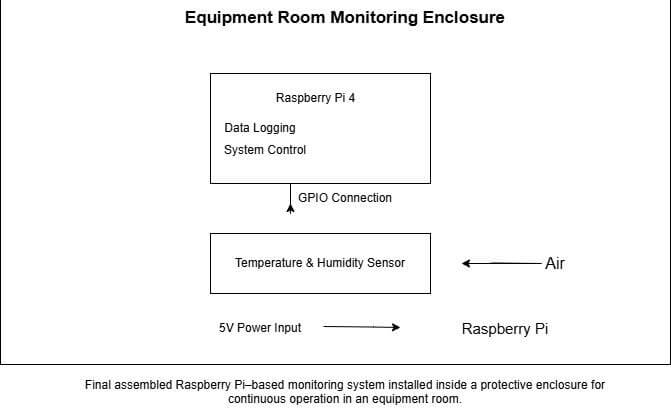
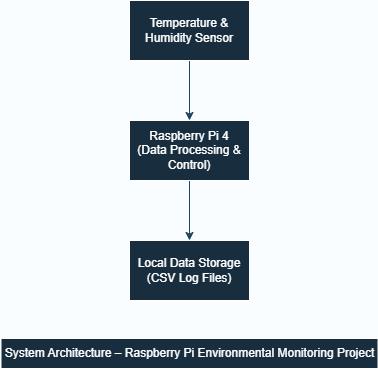
At a system level, the Raspberry Pi serves as the central processing and storage unit, interfacing directly with a digital temperature and humidity sensor via the GPIO header. Sensor readings are acquired at fixed intervals, timestamped, and written to local storage. This design ensures that data collection remains uninterrupted even in the absence of network connectivity or external services.
Instead of adding peripherals such as displays, wireless modules, or external storage devices, the system relies primarily on the Raspberry Pi’s built-in capabilities. This approach reduces wiring complexity and lowers the risk of loose connections or peripheral failures during extended operation.
Sensor placement and enclosure layout were considered early in the design process. The sensor was positioned away from the Raspberry Pi’s processor and power regulation components to avoid self-heating effects that could skew temperature readings. At the same time, it was placed close enough to ventilation openings to accurately reflect ambient conditions within the equipment room.
From a power perspective, the system was designed to operate continuously from a stable 5V supply. No aggressive power-saving strategies were implemented, as consistent uptime was more important than minimizing energy consumption in this application. The Raspberry Pi platform proved well suited to this requirement, offering predictable behavior across reboots and power cycles.
The system architecture also allows for incremental expansion without redesign. Additional sensors or alerting mechanisms could be introduced later if needed, but the initial implementation deliberately avoided overengineering. By keeping the design focused on the core monitoring task, the system remains easy to understand, maintain, and troubleshoot over its service life.
Hardware Selection & Wiring
Hardware selection for this project was guided by reliability, availability, and long-term stability rather than novelty or minimal cost. Since the system was intended to run continuously in an equipment room, components with well-documented behavior and strong community support were preferred.
The Raspberry Pi 4 was chosen as the central controller due to its stable performance, local storage capability via a microSD card, and native support for the required operating system and libraries. Its GPIO header provides sufficient flexibility for direct sensor integration without the need for additional interface boards or adapters.
A digital temperature and humidity sensor was selected to simplify wiring and reduce calibration overhead. Compared to analog sensors, digital devices provide consistent output and are less susceptible to noise over short cable runs. This was particularly important in an enclosed environment, where minimizing wiring complexity and signal variability was a priority.
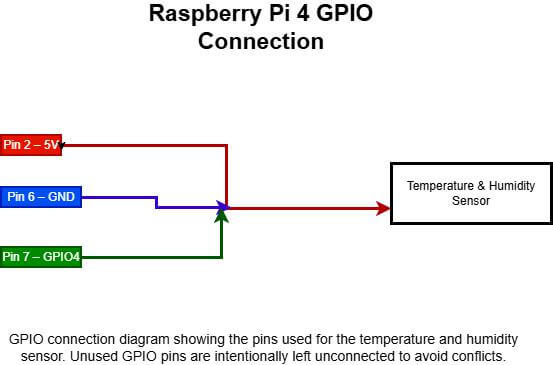
Only three electrical connections were required between the sensor and the Raspberry Pi:
- A power connection supplied directly from the Raspberry Pi
- A common ground reference
- A single GPIO data line for sensor communication
This minimal wiring approach reduced the likelihood of connection issues during long-term operation and simplified troubleshooting if maintenance was required.
Care was taken when selecting the GPIO pin used for data communication. Pins associated with boot configuration or alternate system functions were deliberately avoided to prevent unexpected behavior during startup or reboot. Choosing a general-purpose GPIO ensured consistent operation across power cycles and software updates.
All wiring was kept as short as practical and routed neatly within the enclosure to avoid mechanical strain on connectors. This helped maintain signal integrity and reduced the risk of intermittent faults caused by vibration or accidental movement.
Software Implementation & Data Logging
The software component of the system was designed to prioritize simplicity, readability, and reliability over feature richness. Since the system was intended to run unattended for extended periods, predictability and ease of maintenance were considered more important than aggressive optimization or advanced abstractions.
Python was chosen as the implementation language because it is readily available on Raspberry Pi OS and offers mature libraries for sensor interfacing and file handling. Using Python also made it easy to inspect or modify the script directly on the device during testing, without introducing additional build steps or external dependencies.
The core responsibilities of the software are intentionally limited:
- Read temperature and humidity values from the sensor at fixed intervals
- Attach a timestamp to each reading
- Append the data to a local log file
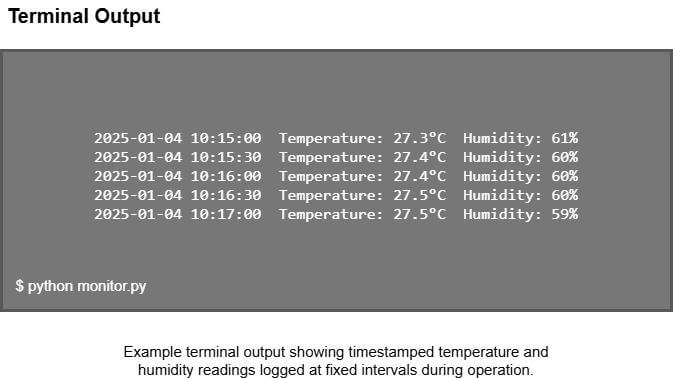
- Provide visible output during testing to confirm correct operation
Rather than relying on background services or complex scheduling mechanisms, the script runs in a simple loop with a controlled delay. This approach proved reliable during long test runs and made the program’s behavior easy to understand when reviewing logs or troubleshooting unexpected results.
Data Acquisition Logic
Each iteration of the loop performs a single sensor read operation. The returned temperature and humidity values are stored temporarily before being written to disk. Timestamps are generated at the time of acquisition rather than inferred later, ensuring that each data point accurately reflects when the measurement occurred.
The decision to append data to a plain text log file was intentional. Plain text logs are easy to inspect manually, transfer to another system, or import into common analysis tools such as spreadsheets or plotting software. This avoided locking the data into a proprietary format or requiring specialized parsing utilities.
Representative Code Example
					import time
from datetime import datetime

while True:
    temperature = read_temperature()
    humidity = read_humidity()
    timestamp = datetime.now().strftime("%Y-%m-%d %H:%M:%S")

    with open("environment_log.txt", "a") as log:
        log.write(f"{timestamp}, {temperature}, {humidity}\n")

    print(f"{timestamp} Temp: {temperature}°C Humidity: {humidity}%")
    time.sleep(30)
This structure keeps the script easy to modify. Sampling intervals can be adjusted by changing a single value, and additional logging fields can be added without restructuring the program. During early testing, the printed output provided immediate confirmation that sensor readings were stable before committing to longer unattended runs.
Basic fault tolerance was preferred over strict error handling. In the event of a transient read failure, the system continues operation rather than terminating. This aligns with the project’s goal of long-term data collection, where occasional missed samples are preferable to complete system downtime.
Testing, Validation & Observations
Testing focused on confirming system stability and data consistency rather than achieving laboratory-grade accuracy. Because the goal of the project was to identify environmental trends over time, repeatability and predictable behavior were prioritized over precise calibration.
Initial validation was performed by running the system continuously while monitoring live output through the terminal. This allowed sensor readings to be observed in real time and helped confirm that the logging process was functioning correctly before leaving the system unattended. During this phase, readings were compared against a handheld reference device to verify that values remained within a reasonable margin.
One of the earliest observations involved component placement within the enclosure. When the sensor was positioned too close to the Raspberry Pi, temperature readings were consistently elevated due to heat generated by the processor and power regulation circuitry. Relocating the sensor closer to ventilation openings resulted in more stable and representative measurements.
The sampling interval was also refined during testing. Shorter intervals produced more granular data but caused log files to grow rapidly over time, while longer intervals reduced storage usage at the risk of missing short-term fluctuations. A balanced interval was selected based on the expected rate of environmental change within the room.
After several days of continuous operation, the logged data began to reveal clear and repeatable trends. Temperature increases during peak daytime hours correlated with periods of higher system load, supporting the original hypothesis that environmental conditions were contributing to equipment instability.
Practical Challenges & Lessons Learned
Several practical considerations emerged during deployment that were not immediately apparent during initial setup. Enclosure design, for example, required balancing physical protection with adequate airflow. Fully sealed enclosures delayed sensor response to ambient changes, while overly open designs increased exposure to dust and debris.
Another lesson involved GPIO pin selection. Early prototypes exhibited inconsistent behavior during reboot until pins associated with alternate system functions were avoided.
Long-term operation also highlighted the value of keeping the system simple. By avoiding unnecessary peripherals and complex software layers, the system proved easier to maintain and troubleshoot. Occasional sensor read errors did not interrupt operation, and data logging continued without manual intervention.
Final Thoughts
Overall, the project reinforced that effective environmental monitoring depends as much on deployment details as on hardware choice. Careful consideration of placement, wiring, and system behavior under real operating conditions significantly improved data quality and system reliability.
If you’re planning a similar monitoring deployment and want to reduce the risk of design or integration issues, PCBCool can support the full lifecycle—from hardware selection and prototyping to assembly and long-term deployment. Our experience with real-world industrial environments helps ensure that systems remain reliable over time.
Frequently Asked Questions (FAQ)
A: Yes, but long-term reliability depends on power stability, SD card quality, cooling, and software resilience.
A: Use log rotation, reduce write frequency, and consider using a high-endurance SD card. You can also write to an external USB drive or use RAM buffering to reduce constant writes.
A: It depends on your needs. Microcontrollers are more power-efficient and simple, but a Raspberry Pi is easier for local storage, debugging, and software flexibility.
A: Keep the sensor away from the Pi’s processor and voltage regulators, and provide ventilation. You can also add a small fan or use thermal isolation materials.
A: It depends on how fast the environment changes. For most equipment rooms, every 30 seconds to 5 minutes is sufficient. Shorter intervals generate more data and increase SD writes.
A: Use a UPS or battery backup, and design the software to handle abrupt shutdowns by flushing logs and closing files safely. You can also keep the last known state in a separate file.
A: Digital sensors often come calibrated, but environmental drift and placement can still cause bias. Calibration is recommended if you need high accuracy.
A: Yes, if the system is designed modularly. You should plan for additional GPIO pins, power budget, and data format from the start.
A: Wi-Fi is convenient, but Ethernet is more stable in industrial environments. If network reliability is uncertain, local logging should remain the primary method.
A: Use a process manager (like systemd) to auto-restart the script. Also consider watchdog mechanisms and proper error handling.
A: Export logs to CSV and use spreadsheets, or use Python scripts to generate plots. For more advanced use, you can integrate with Grafana or InfluxDB later.
A: Disable unnecessary services, use strong passwords, keep the OS updated, and consider firewall rules.
A: A case helps protect against dust and accidental contact, but it must also allow airflow. Many deployments use ventilated or perforated cases.
A: Use the Raspberry Pi’s internal clock and ensure it is synchronized periodically when internet is available. If accuracy is critical, consider a real-time clock (RTC) module.
A: Check placement, airflow, and nearby heat sources. Also validate the sensor cable and ensure it is not subject to interference or loose connections.

George is a certified electrical engineer with experience in PCB design, embedded systems, and IoT hardware development. He works with PCBCool to turn real engineering experience into practical guides for developers and engineers.